Understanding the DevOps Lifecycle

Introduction

In today’s fast-paced software development environment, DevOps has become an essential methodology for delivering high-quality software swiftly. DevOps bridges the gap between development and operations, fostering a culture of collaboration and continuous improvement. This blog post delves into the DevOps lifecycle, highlighting its stages with practical examples and links to additional resources for a deeper understanding.

DevOps Lifecycle

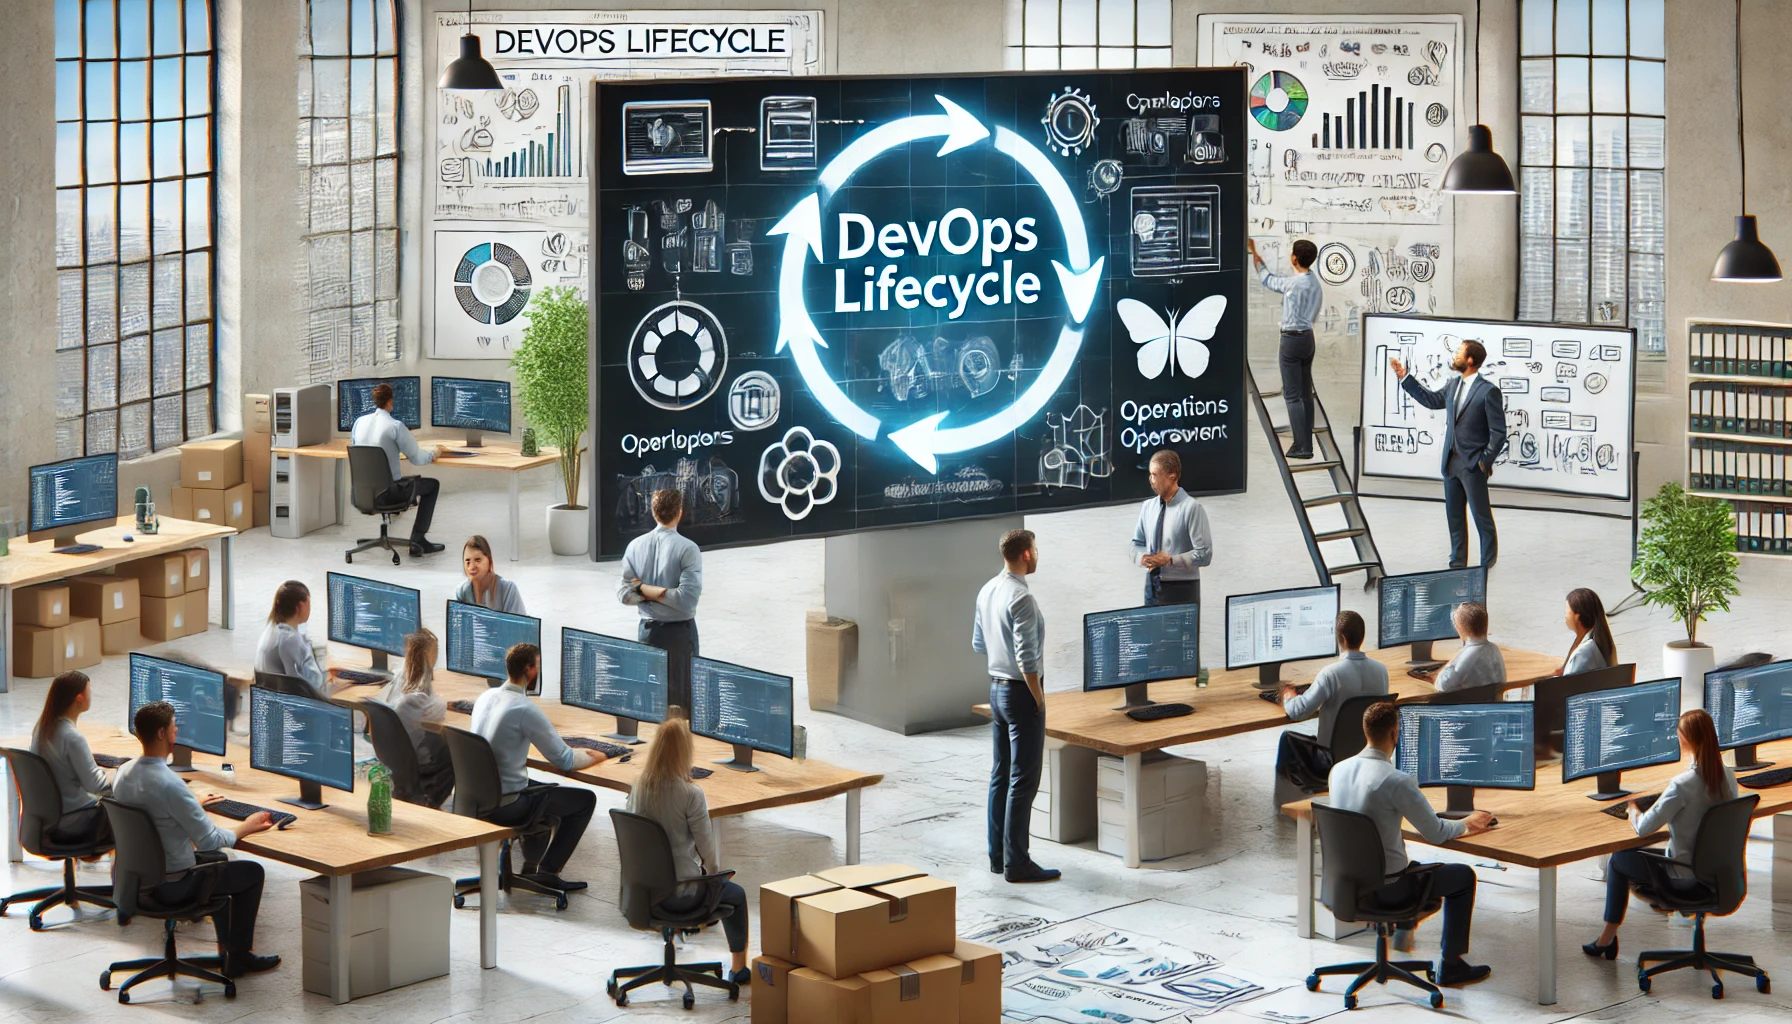
The DevOps lifecycle is a continuous process composed of several key stages: planning, coding, building, testing, releasing, deploying, operating, and monitoring. Each stage plays a crucial role in ensuring the seamless delivery and maintenance of applications.

Planning

The planning stage involves defining project requirements and setting objectives. Tools like Jira and Trello are commonly used to manage tasks and track progress. For instance, a development team planning a new feature might use Jira to create user stories and tasks, outlining the specific functionality and the steps needed to achieve it.

Additional Material: Atlassian’s Guide to Agile Project Management

Coding

In the coding stage, developers write the application code. Version control systems like Git are used to manage changes and collaborate efficiently. For example, developers working on a new microservice might use GitHub for source code management, ensuring that changes are tracked and can be easily rolled back if necessary.

Additional Material: Pro Git Book

Building

Building involves compiling the source code into executable artifacts. This stage often includes packaging the application for deployment. Using Jenkins for continuous integration, the build process can automatically compile code, run tests, and create Docker images ready for deployment.

Additional Material: Jenkins Documentation

Testing

Automated testing ensures that the application functions correctly and meets the specified requirements. Tools like Selenium and JUnit are popular in this stage. For instance, implementing a suite of automated tests in Selenium to verify the functionality of a web application across different browsers.

Additional Material: SeleniumHQ

Releasing

Releasing is the process of making the application available for deployment. This stage involves versioning and tagging releases. Using Git tags to mark a particular commit as a release candidate, ready for deployment to a staging environment for final verification.

Additional Material: Semantic Versioning

Deploying

Deployment involves moving the application to a live environment. Tools like Kubernetes and Ansible help automate this process, ensuring consistency and reliability. For example, deploying a containerized application to a Kubernetes cluster, using Helm charts to manage the deployment configuration.

Additional Material: Kubernetes Documentation

Operating

In the operating stage, the application runs in the production environment. Ensuring uptime and performance is critical, often managed through infrastructure as code practices. Using Terraform to provision and manage cloud infrastructure, ensuring that environments are consistent and scalable.

Additional Material: Terraform by HashiCorp

Monitoring

Continuous monitoring and logging are essential to detect issues and improve the system. Tools like Prometheus and ELK Stack (Elasticsearch, Logstash, Kibana) are widely used. Implementing Prometheus to collect metrics and Grafana to visualize the performance of a microservices architecture.

Additional Material: Prometheus Documentation

Wrapping it all up

The DevOps lifecycle is a continuous journey of improvement and collaboration. By integrating and automating each stage, teams can deliver robust and reliable software faster and more efficiently. Embracing DevOps practices not only enhances the quality of software but also fosters a culture of continuous learning and adaptation.

For those looking to dive deeper into DevOps, the additional materials provided offer a wealth of knowledge and practical guidance. Embrace the DevOps mindset, and transform your software development process into a well-oiled, efficient machine.

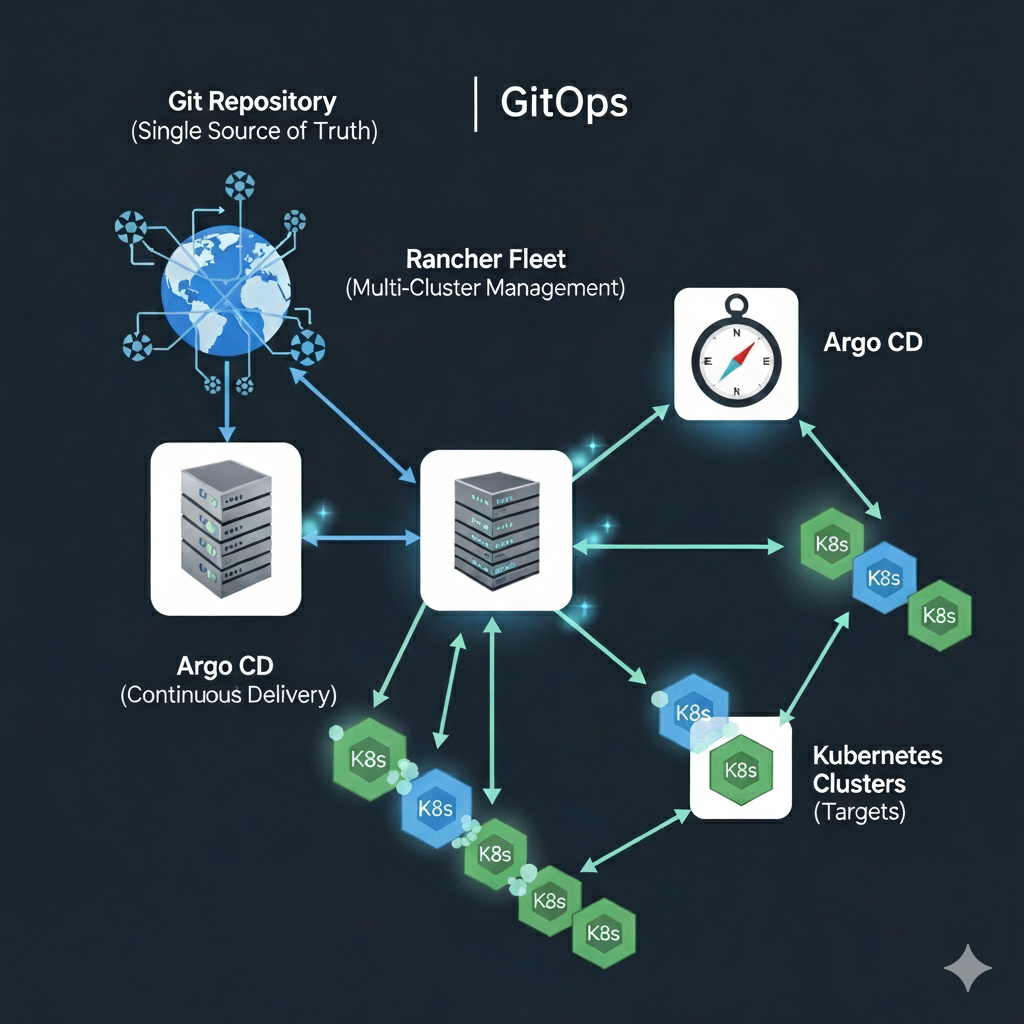
Keep in mind this is a very high level list of some of the most commonly used tools everyday. There’s no mention of platforms here such as Rancher as it was intentionally kept high level. Future content will provide insights into best practices, other platforms, and how to be successful in a Devops world.

By

Read More

Setting Up Your Development Environment

Welcome! Setting up a development environment is the first crucial step towards efficient and productive coding. In this blog post, we will walk you through the process of setting up a development environment, covering essential tools, configurations, and tips to get you started.


Why a Good Development Environment Matters

A well-configured development environment can significantly boost your productivity by providing the necessary tools and workflows to write, test, and debug code efficiently. It also helps in maintaining consistency across different projects and teams.


1. Choosing the Right Operating System

Your choice of operating system (OS) can influence your development experience. The three most common options are:

  1. Windows: Popular for its user-friendly interface and compatibility with various software.
  2. macOS: Preferred by many developers for its Unix-based system and seamless integration with Apple hardware.
  3. Linux: Highly customizable and open-source, making it a favorite among developers who prefer full control over their environment.

Resources:


2. Installing Essential Tools

Here are some essential tools you’ll need in your development environment:

Code Editor/IDE:

Version Control System:

  • Git: Essential for source code management. Download Git or “zypper in git-core

Package Managers:

  • zypper (openSUSE): Choose from a number of maintained packages.
  • Homebrew (macOS/Linux): Simplifies software installation. Install Homebrew
  • Chocolatey (Windows): Easy software management on Windows. Install Chocolatey

Terminal Emulator:


3. Setting Up Git and GitHub

Git is a crucial tool for version control and collaboration. Setting up Git and connecting it to GitHub is essential.

Installing Git:

# On macOS using Homebrew
brew install git

# On openSUSE
sudo zypper in git-core

# On Windows (via Chocolatey)
choco install git

Configuring Git:

# Set your username and email
git config --global user.name "Your Name"
git config --global user.email "you@example.com"

Connecting to GitHub:

  1. Create a GitHub account.
  2. Generate an SSH key.
  3. Add the SSH key to your GitHub account: Adding a new SSH key.

4. Configuring Your Code Editor/IDE

Visual Studio Code (VS Code):

  1. Install Extensions:
  • Python: For Python development.
  • Prettier: Code formatter.
  • ESLint: JavaScript linter.
  • VS Code Marketplace
  1. Settings Sync: Sync your settings across multiple machines. Settings Sync

IntelliJ IDEA:

  1. Plugins: Install necessary plugins for your development stack.
  2. Themes and Keymaps: Customize the appearance and shortcuts. IntelliJ Plugins

5. Setting Up Your Development Stack

Depending on your technology stack, you will need to install additional tools and libraries.

For JavaScript/Node.js Development:

  1. Node.js: JavaScript runtime. Download Node.js
  2. npm: Node package manager, included with Node.js.
  3. yarn: Alternative package manager. Install Yarn

For Python Development:

  1. Python: Install the latest version. Download Python
  2. pip: Python package installer, included with Python.
  3. Virtualenv: Create isolated Python environments. Virtualenv Documentation

For Java Development:

  1. JDK: Java Development Kit. Download JDK
  2. Maven/Gradle: Build tools. Maven, Gradle

6. Configuring Development Environments for Web Development

Setting Up a LAMP Stack on Linux:

  1. Apache: Web server.
  2. MariaDB: Database server.
  3. PHP: Scripting language.
sudo zypper ref
sudo zypper in apache2
sudo zypper in mariadb mariadb-tools
sudo zypper in php libapache2-mod-php php-mysql

Setting Up a MEAN Stack:

  1. MongoDB: NoSQL database.
  2. Express.js: Web framework for Node.js.
  3. Angular: Front-end framework.
  4. Node.js: JavaScript runtime.
# Install MongoDB
brew tap mongodb/brew
brew install mongodb-community@5.0

# Install Express.js and Angular CLI
npm install -g express-generator @angular/cli

Conclusion

Setting up a robust development environment is the cornerstone of efficient software development. By following the steps outlined in this post, you’ll have a well-configured environment tailored to your needs, ready to tackle any project.

Additional Resources:

Stay tuned for more tutorials and guides to enhance your development experience. Happy coding!


By

Read More

Essential Skills for a Platform Engineer

Welcome to the next step in your journey to becoming a platform engineer!

Platform engineering is a dynamic and multifaceted field that requires a diverse set of skills. In this blog post, we’ll explore the essential skills every platform engineer needs, along with practical examples and resources to help you develop these skills.


1. Proficiency in Programming and Scripting

Platform engineers need strong programming and scripting skills to automate tasks and build tools.

Key Languages:

  • Python: Widely used for scripting and automation.
  • Go: Popular for building high-performance tools.
  • Bash: Essential for shell scripting.

Example: Automating Infrastructure Deployment with Python

import boto3

ec2 = boto3.client('ec2')

def create_instance():
    response = ec2.run_instances(
        ImageId='ami-0abcdef1234567890',
        InstanceType='t2.micro',
        MinCount=1,
        MaxCount=1
    )
    print("EC2 Instance Created: ", response['Instances'][0]['InstanceId'])

create_instance()

Simple. You’ve just created a EC2 instance using python. Ok…there’s a little more to it. Read on.

Resources:


2. Understanding of Cloud Platforms

Proficiency with cloud platforms like AWS, Azure, or Google Cloud is crucial for platform engineers.

Key Concepts:

  • Compute Services: EC2, Azure VMs, Google Compute Engine.
  • Storage Solutions: S3, Azure Blob Storage, Google Cloud Storage.
  • Networking: VPC, Subnets, Security Groups.

Example: Deploying a Web Server on AWS EC2

# Launch an EC2 instance
aws ec2 run-instances --image-id ami-09c5b2a6c0dda02e1 --instance-type t2.micro --key-name MyKeyPair

# Install Apache Web Server
ssh -i "MyKeyPair.pem" ec2-user@<instance-ip>
sudo zypper in apache2
sudo systemctl start apache2

Above is a few command-line code snippets using the aws cli and ssh to create an openSUSE instance and install the apache web server.

Resources:


3. Familiarity with Containerization and Orchestration

Understanding Docker Podman and Kubernetes is essential for managing containerized applications.

Key Concepts:

  • Podman: open source tool for developing, managing, and running containers
  • Docker: Containerization platform to package applications.
  • Kubernetes: Orchestration platform to manage containerized applications.

Example: Deploying a Docker Container

# Build Podman image
podman build -t my-app .

# Run Podman container
podman run -d -p 8080:80 my-app

Resources:


4. Knowledge of CI/CD Pipelines

CI/CD pipelines are the backbone of modern software development, ensuring continuous integration and delivery.

Key Tools:

  • Jenkins: Popular CI/CD automation server.
  • GitHub Actions: Integrated CI/CD service in GitHub.
  • GitLab CI: Integrated CI/CD tool in GitLab.

Example: Simple Jenkins Pipeline

pipeline {
    agent any
    stages {
        stage('Build') {
            steps {
                sh 'mvn clean package'
            }
        }
        stage('Test') {
            steps {
                sh 'mvn test'
            }
        }
        stage('Deploy') {
            steps {
                sh 'mvn deploy'
            }
        }
    }
}

Resources:


5. Monitoring and Logging

Effective monitoring and logging are crucial for maintaining the health and performance of systems.

Key Tools:

  • Prometheus: Monitoring and alerting toolkit.
  • Grafana: Data visualization and monitoring with support for Prometheus.
  • ELK Stack: Elasticsearch, Logstash, and Kibana for logging and search.

Example: Basic Prometheus Configuration

global:
  scrape_interval: 15s

scrape_configs:
  - job_name: 'prometheus'
    static_configs:
      - targets: ['localhost:9090']

Resources:


6. Security Best Practices

Security is a critical aspect of platform engineering, ensuring systems are protected from threats.

Key Practices:

  • IAM (Identity and Access Management): Managing user access and permissions.
  • Network Security: Configuring firewalls and security groups.
  • Secret Management: Storing and managing sensitive information.

Example: AWS IAM Policy

{
  "Version": "2012-10-17",
  "Statement": [
    {
      "Effect": "Allow",
      "Action": "s3:*",
      "Resource": "arn:aws:s3:::example-bucket/*"
    }
  ]
}

Resources:


Conclusion

Developing these essential skills will provide a strong foundation for your career as a platform engineer. From programming and cloud platforms to CI/CD and security, mastering these areas will enable you to build robust, scalable, and efficient platforms.

Additional Resources:

Stay tuned for more detailed guides and tutorials on each of these skills. Happy learning and coding!


By

Read More

Site update news!

First and foremost! Keep the comments coming. Even though there is tons of junk to sift through a good number of actually valid suggestions to improve this site have been made. Keep ’em coming.

We’ve added a new category, Getting Started. You will begin seeing articles in different series which will help in your cloud-native journey. As they are written they will be posted under the Getting Started category.

Thanks for reading. If you wish to request content or have questions please do so via a pingback.

The site will be going through a reorganization in the coming weeks and months to better serve you and address the comments and suggestions. Stay tuned for more!

By

Read More

Introduction to Platform Engineering and DevOps

Welcome to the world of Platform Engineering and DevOps!

We are here to get you started on your journey. We will explore what platform engineering and DevOps are, why they are important, and how they work together to streamline software development and delivery. Whether you’re new to the field or looking to deepen your understanding, this introduction will set the foundation for your journey. Read on!


What is Platform Engineering?

Platform engineering is the discipline of designing and building toolchains and workflows that enable self-service capabilities for software engineering teams in a cloud-native environment. The primary goal is to enhance developer productivity by creating reliable, scalable, and maintainable platforms.

Key Responsibilities of Platform Engineers:

  1. Infrastructure Management: Automating the setup and management of infrastructure.
  2. Tooling Development: Building and maintaining internal tools and platforms.
  3. Continuous Integration/Continuous Deployment (CI/CD): Implementing and managing CI/CD pipelines.
  4. Monitoring and Logging: Setting up robust monitoring and logging solutions.

What is DevOps?

DevOps is a set of practices that combine software development (Dev) and IT operations (Ops). The aim is to shorten the system development lifecycle and deliver high-quality software continuously. DevOps emphasizes collaboration, automation, and iterative improvement.

Core DevOps Practices:

  1. Continuous Integration (CI): Regularly integrating code changes into a shared repository.
  2. Continuous Delivery (CD): Automatically deploying code to production environments.
  3. Infrastructure as Code (IaC): Managing infrastructure through code, rather than manual processes.
  4. Monitoring and Logging: Continuously monitoring systems and applications to ensure reliability and performance.

How Platform Engineering and DevOps Work Together

Platform engineering provides the tools and infrastructure necessary for DevOps practices to thrive. By creating platforms that automate and streamline development processes, platform engineers enable development teams to focus on writing code and delivering features.

Example Workflow:

  1. Infrastructure as Code (IaC): Platform engineers use tools like Terraform or AWS CloudFormation to provision and manage infrastructure. Learn more about OpenTofu.
  2. CI/CD Pipelines: Jenkins, GitLab CI, or GitHub Actions are set up to automatically build, test, and deploy applications. Explore GitHub Actions.
  3. Monitoring and Logging: Tools like Prometheus and Grafana are used to monitor applications and infrastructure, providing insights into performance and health. Get started with Prometheus.

Real-World Example: Implementing a CI/CD Pipeline

Let’s walk through a simple CI/CD pipeline implementation using GitHub Actions.

Step 1: Define the Workflow File
Create a .github/workflows/ci-cd.yml file in your repository:

name: CI/CD Pipeline

on:
  push:
    branches:
      - main

jobs:
  build:
    runs-on: ubuntu-latest

    steps:
    - name: Checkout code
      uses: actions/checkout@v2

    - name: Set up Node.js
      uses: actions/setup-node@v2
      with:
        node-version: '14'

    - name: Install dependencies
      run: npm install

    - name: Run tests
      run: npm test

    - name: Deploy to production
      if: github.ref == 'refs/heads/main'
      run: npm run deploy

Step 2: Commit and Push
Commit the workflow file and push it to your repository. GitHub Actions will automatically trigger the CI/CD pipeline for every push to the main branch.

Step 3: Monitor the Pipeline
You can monitor the progress and results of your pipeline in the “Actions” tab of your GitHub repository.

Additional Resources:


Conclusion

Platform engineering and DevOps are integral to modern software development, providing the tools and practices needed to deliver high-quality software quickly and reliably. By understanding and implementing these concepts, you can significantly enhance your development workflow and drive continuous improvement in your organization.

Stay tuned for more in-depth posts on specific topics, tools, and best practices in platform engineering and DevOps.

Happy coding!


By

Read More

Enhancing Kubernetes Observability with Prometheus, Grafana, Falco, and Microsoft Retina

Introduction

In the dynamic and distributed world of Kubernetes, ensuring the reliability, performance, and security of applications is paramount. Observability plays a crucial role in achieving these goals, providing insights into the health and behavior of applications and infrastructure. This post delves into the technical aspects of Kubernetes observability, focusing on four pivotal tools: Prometheus with Grafana, Falco, and Microsoft Retina. We will explore how to leverage these tools to monitor metrics, logs, and security threats, complete with code examples and configuration tips.

1. Prometheus and Grafana for Metrics Monitoring

Prometheus, an open-source monitoring solution, collects and stores metrics as time series data. Grafana, a visualization platform, complements Prometheus by offering a powerful interface for visualizing and analyzing these metrics. Together, they provide a comprehensive monitoring solution for Kubernetes clusters.

Setting Up Prometheus and Grafana

Prometheus Installation:

  1. Deploy Prometheus using Helm:
   helm repo add prometheus-community https://prometheus-community.github.io/helm-charts
   helm repo update
   helm install prometheus prometheus-community/kube-prometheus-stack
  1. The above command deploys Prometheus with a default set of alerts and dashboards suitable for Kubernetes.

Grafana Installation:

Grafana is included in the kube-prometheus-stack Helm chart, simplifying the setup process.

Accessing Grafana:

  • Retrieve the Grafana admin password:
  kubectl get secret --namespace default prometheus-grafana -o jsonpath="{.data.admin-password}" | base64 --decode ; echo
  • Port-forward the Grafana pod to access the UI:
  kubectl port-forward deployment/prometheus-grafana 3000
  • Visit http://localhost:3000 and log in with the username admin and the retrieved password.

Example: Creating a Dashboard for Pod Metrics

  1. In Grafana, click on “Create” > “Dashboard” > “Add new panel”.
  2. Select “Prometheus” as the data source and enter a query, e.g., rate(container_cpu_usage_seconds_total{namespace="default"}[5m]) to display CPU usage.
  3. Configure the panel with appropriate titles and visualization settings.
  4. Save the dashboard.
  5. Search around, you’ll find PLENTY of dashboards available for use.

2. Falco for Security Monitoring

Falco, an open-source project by the CNCF, is designed to monitor and alert on anomalous activity in your Kubernetes clusters, acting as a powerful security monitoring tool. Keep in mind Falco is monitoring only…use a tool such as NeuVector for strong Kubernetes security.

Falco Installation and Configuration

  1. Install Falco using Helm:
   helm repo add falcosecurity https://falcosecurity.github.io/charts
   helm repo update
   helm install falco falcosecurity/falco
  1. Configure custom rules by creating a falco-config ConfigMap with your detection rules in YAML format.

Example: Alerting on Shell Execution in Containers

  1. Add the following rule to your Falco configuration:
   - rule: Shell in container
     desc: Detect shell execution in a container
     condition: spawned_process and container and proc.name = bash
     output: "Shell executed in container (user=%user.name container=%container.id command=%proc.cmdline)"
     priority: WARNING
  1. Deploy the ConfigMap and restart Falco to apply changes.

3. Microsoft Retina for Network Observability

Microsoft Retina is a network observability tool for Kubernetes, providing deep insights into network traffic and security within clusters.

Setting Up Microsoft Retina

  1. Clone the Retina repository:
   git clone https://github.com/microsoft/retina
  1. Deploy Retina in your cluster:
   kubectl apply -f retina/deploy/kubernetes/
  1. Configure network policies and telemetry settings as per your requirements in the Retina ConfigMap.

Example: Monitoring Ingress Traffic

  1. To monitor ingress traffic, ensure Retina’s telemetry settings include ingress controllers and services.
  2. Use Retina’s dashboard to visualize traffic patterns, identify anomalies, and drill down into specific metrics for troubleshooting.

Wrapping up

Effective observability in Kubernetes is crucial for maintaining operational excellence. By leveraging Prometheus and Grafana for metrics monitoring, Falco for security insights, and Microsoft Retina for network observability, platform engineers can gain comprehensive visibility into their clusters. The integration and configuration examples provided in this post offer a starting point for deploying these tools in your environment. Remember, the key to successful observability is not just the tools you use, but how you use them to drive actionable insights.

By

Read More

Automating Kubernetes Clusters

Kubernetes is definitely the de facto standard for container orchestration, powering modern cloud-native applications. As organizations scale their infrastructure, managing Kubernetes clusters efficiently becomes increasingly critical. Manual cluster provisioning can be time-consuming and error-prone, leading to operational inefficiencies. To address these challenges, Kubernetes introduced the Cluster API, an extension that enables the management of Kubernetes clusters through a Kubernetes-native API. In this blog post, we’ll delve into leveraging ClusterClass and the Cluster API to automate the creation of Kubernetes clusters.

Let’s understand ClusterClass

ClusterClass is a Kubernetes Custom Resource Definition (CRD) introduced as part of the Cluster API. It serves as a blueprint for defining the desired state of a Kubernetes cluster. ClusterClass encapsulates various configuration parameters such as node instance types, networking settings, and authentication mechanisms, enabling users to define standardized cluster configurations.

Setting Up Cluster API

Before diving into ClusterClass, it’s essential to set up the Cluster API components within your Kubernetes environment. This typically involves deploying the Cluster API controllers and providers, such as AWS, Azure, or vSphere, depending on your infrastructure provider.

Creating a ClusterClass

Once the Cluster API is set up, defining a ClusterClass involves creating a Custom Resource (CR) using the ClusterClass schema. This example YAML manifest defines a ClusterClass:

apiVersion: cluster.x-k8s.io/v1alpha3
kind: ClusterClass
metadata:
  name: my-cluster-class
spec:
  infrastructureRef:
    kind: InfrastructureCluster
    apiVersion: infrastructure.cluster.x-k8s.io/v1alpha3
    name: my-infrastructure-cluster
  topology:
    controlPlane:
      count: 1
      machine:
        type: my-control-plane-machine
    workers:
      count: 3
      machine:
        type: my-worker-machine
  versions:
    kubernetes:
      version: 1.22.4

In this example:

  • metadata.name specifies the name of the ClusterClass.
  • spec.infrastructureRef references the InfrastructureCluster CR that defines the underlying infrastructure provider details.
  • spec.topology describes the desired cluster topology, including the number and type of control plane and worker nodes.
  • spec.versions.kubernetes.version specifies the desired Kubernetes version.

Applying the ClusterClass

Once the ClusterClass is defined, it can be applied to instantiate a Kubernetes cluster. The Cluster API controllers interpret the ClusterClass definition and orchestrate the creation of the cluster accordingly. Applying the ClusterClass typically involves creating an instance of the ClusterClass CR:

kubectl apply -f my-cluster-class.yaml

Managing Cluster Lifecycle

The Cluster API facilitates the entire lifecycle management of Kubernetes clusters, including creation, scaling, upgrading, and deletion. Users can modify the ClusterClass definition to adjust cluster configurations dynamically. For example, scaling the cluster can be achieved by updating the spec.topology.workers.count field in the ClusterClass and reapplying the changes.

Monitoring and Maintenance

Automation of cluster creation with ClusterClass and the Cluster API streamlines the provisioning process, reduces manual intervention, and enhances reproducibility. However, monitoring and maintenance of clusters remain essential tasks. Utilizing Kubernetes-native monitoring solutions like Prometheus and Grafana can provide insights into cluster health and performance metrics.

Wrapping it up

Automating Kubernetes cluster creation using ClusterClass and the Cluster API simplifies the management of infrastructure at scale. By defining cluster configurations as code and leveraging Kubernetes-native APIs, organizations can achieve consistency, reliability, and efficiency in their Kubernetes deployments. Embracing these practices empowers teams to focus more on application development and innovation, accelerating the journey towards cloud-native excellence.

By

Read More

Implementing CI/CD with Kubernetes: A Guide Using Argo and Harbor

Why CI/CD?

Continuous Integration (CI) and Continuous Deployment (CD) are essential practices in modern software development, enabling teams to automate the testing and deployment of applications. Kubernetes, an open-source platform for managing containerized workloads and services, has become the go-to solution for deploying, scaling, and managing applications. Integrating CI/CD pipelines with Kubernetes can significantly enhance the efficiency and reliability of software delivery processes. In this blog post, we’ll explore how to implement CI/CD with Kubernetes using two powerful tools: Argo for continuous deployment and Harbor as a container registry.

Understanding CI/CD and Kubernetes

Before diving into the specifics, let’s briefly understand what CI/CD and Kubernetes are:

  • Continuous Integration (CI): A practice where developers frequently merge their code changes into a central repository, after which automated builds and tests are run. The main goals of CI are to find and address bugs quicker, improve software quality, and reduce the time it takes to validate and release new software updates.
  • Continuous Deployment (CD): The next step after continuous integration, where all code changes are automatically deployed to a staging or production environment after the build stage. This ensures that the codebase is always in a deployable state.
  • Kubernetes: An open-source system for automating deployment, scaling, and management of containerized applications. It groups containers that make up an application into logical units for easy management and discovery.

Why Use Argo and Harbor with Kubernetes?

  • Argo CD: A declarative, GitOps continuous delivery tool for Kubernetes. Argo CD facilitates the automated deployment of applications to specified target environments based on configurations defined in a Git repository. It simplifies the management of Kubernetes resources and ensures that the live applications are synchronized with the desired state specified in Git.
  • Harbor: An open-source container image registry that secures artifacts with policies and role-based access control, ensures images are scanned and free from vulnerabilities, and signs images as trusted. Harbor integrates well with Kubernetes, providing a reliable location for storing and managing container images.

Implementing CI/CD with Kubernetes Using Argo and Harbor

Step 1: Setting Up Harbor as Your Container Registry

  1. Install Harbor: First, you need to install Harbor on your Kubernetes cluster. You can use Helm, a package manager for Kubernetes, to simplify the installation process. Ensure you have Helm installed and then add the Harbor chart repository:
   helm repo add harbor https://helm.goharbor.io
   helm install my-harbor harbor/harbor
  1. Configure Harbor: After installation, configure Harbor by accessing its web UI through the exposed service IP or hostname. Set up projects, users, and access controls as needed.
  2. Push Your Container Images: Build your Docker images and push them to your Harbor registry. Ensure your Kubernetes cluster can access Harbor and pull images from it.
   docker tag my-app:latest my-harbor-domain.com/my-project/my-app:latest
   docker push my-harbor-domain.com/my-project/my-app:latest

Step 2: Setting Up Argo CD for Continuous Deployment

  1. Install Argo CD: Install Argo CD on your Kubernetes cluster. You can use the following commands to create the necessary resources:
   kubectl create namespace argocd
   kubectl apply -n argocd -f https://raw.githubusercontent.com/argoproj/argo-cd/stable/manifests/install.yaml
  1. Access Argo CD: Access the Argo CD UI by exposing the Argo CD API server service. You can use port forwarding:
   kubectl port-forward svc/argocd-server -n argocd 8080:443

Then, access the UI through http://localhost:8080.

  1. Configure Your Application in Argo CD: Define your application in Argo CD, specifying the source (your Git repository) and the destination (your Kubernetes cluster). You can do this through the UI or by applying an application manifest file.
   apiVersion: argoproj.io/v1alpha1
   kind: Application
   metadata:
     name: my-app
     namespace: argocd
   spec:
     project: default
     source:
       repoURL: 'https://my-git-repo.com/my-app.git'
       path: k8s
       targetRevision: HEAD
     destination:
       server: 'https://kubernetes.default.svc'
       namespace: my-app-namespace
  1. Deploy Your Application: Once configured, Argo CD will automatically deploy your application based on the configurations in your Git repository. It continuously monitors the repository for changes and applies them to your Kubernetes cluster, ensuring that the deployed applications are always up-to-date.
  2. Monitor and Manage Deployments: Use the Argo CD UI to monitor the status of your deployments, visualize the application topology, and manage rollbacks or manual syncs if necessary.

Wrapping it all up

Integrating CI/CD pipelines with Kubernetes using Argo for continuous deployment and Harbor as a container registry can streamline the process of building, testing, and deploying applications. By leveraging these tools, teams can achieve faster development cycles, improved reliability, and better security practices. Remember, the key to successful CI/CD implementation lies in continuous testing, monitoring, and feedback throughout the lifecycle of your applications.

Want more? Just ask in the comments.

By

Read More

Declarative vs Imperative Operations in Kubernetes: A Deep Dive with Code Examples

Kubernetes, the de facto orchestrator for containerized applications, offers two distinct approaches to managing resources: declarative and imperative. Understanding the nuances between these two can significantly impact the efficiency, reliability, and scalability of your applications. In this post, we’ll dissect the differences, advantages, and use cases of declarative and imperative operations in Kubernetes, supplemented with code examples for popular workloads.

Imperative Operations: Direct Control at Your Fingertips

Imperative operations in Kubernetes involve commands that make changes to the cluster directly. This approach is akin to giving step-by-step instructions to Kubernetes about what you want to happen. It’s like telling a chef exactly how to make a dish, rather than giving them a recipe to follow.

Example: Running an NGINX Deployment

Consider deploying an NGINX server. An imperative command would be:

kubectl run nginx --image=nginx:1.17.10 --replicas=3

This command creates a deployment named nginx, using the nginx:1.17.10 image, and scales it to three replicas. It’s straightforward and excellent for quick tasks or one-off deployments.

Modifying a Deployment Imperatively

To update the number of replicas imperatively, you’d execute:

kubectl scale deployment/nginx --replicas=5

This command changes the replica count to five. While this method offers immediate results, it lacks the self-documenting and version control benefits of declarative operations.

Declarative Operations: The Power of Describing Desired State

Declarative operations, on the other hand, involve defining the desired state of the system in configuration files. Kubernetes then works to make the cluster match the desired state. It’s like giving the chef a recipe; they know the intended outcome and can figure out how to get there.

Example: NGINX Deployment via a Manifest File

Here’s how you would define the same NGINX deployment declaratively:

apiVersion: apps/v1
kind: Deployment
metadata:
  name: nginx
spec:
  replicas: 3
  selector:
    matchLabels:
      app: nginx
  template:
    metadata:
      labels:
        app: nginx
    spec:
      containers:
      - name: nginx
        image: nginx:1.17.10

You would apply this configuration using:

kubectl apply -f nginx-deployment.yaml

Updating a Deployment Declaratively

To change the number of replicas, you would edit the nginx-deployment.yaml file to set replicas: 5 and reapply it.

spec:
  replicas: 5

Then apply the changes:

kubectl apply -f nginx-deployment.yaml

Kubernetes compares the desired state in the YAML file with the current state of the cluster and makes the necessary changes. This approach is idempotent, meaning you can apply the configuration multiple times without changing the result beyond the initial application.

Best Practices and When to Use Each Approach

Imperative:

  • Quick Prototyping: When you need to quickly test or prototype something, imperative commands are the way to go.
  • Learning and Debugging: For beginners learning Kubernetes or when debugging, imperative commands can be more intuitive and provide immediate feedback.

Declarative:

  • Infrastructure as Code (IaC): Declarative configurations can be stored in version control, providing a history of changes and facilitating collaboration.
  • Continuous Deployment: In a CI/CD pipeline, declarative configurations ensure that the deployed application matches the source of truth in your repository.
  • Complex Workloads: Declarative operations shine with complex workloads, where dependencies and the order of operations can become cumbersome to manage imperatively.

Conclusion

In Kubernetes, the choice between declarative and imperative operations boils down to the context of your work. For one-off tasks, imperative commands offer simplicity and speed. However, for managing production workloads and achieving reliable, repeatable deployments, declarative operations are the gold standard.

As you grow in your Kubernetes journey, you’ll likely find yourself using a mix of both approaches. The key is to understand the strengths and limitations of each and choose the right tool for the job at hand.

Remember, Kubernetes is a powerful system that demands respect for its complexity. Whether you choose the imperative wand or the declarative blueprint, always aim for practices that enhance maintainability, scalability, and clarity within your team. Happy orchestrating!

By

Read More

Leveraging Automation in Managing Kubernetes Clusters: The Path to Efficient Operation

Automation in managing Kubernetes clusters has burgeoned into an essential practice that enhances efficiency, security, and the seamless deployment of applications. With the exponential growth in containerized applications, automation has facilitated streamlined operations, reducing the room for human error while significantly saving time. Let’s delve deeper into the crucial role automation plays in managing Kubernetes clusters.

The Imperative of Automation in Kubernetes

Kubernetes Architecture

The Kubernetes Landscape

Before delving into the nuances of automation, let’s briefly recapitulate the fundamental components of Kubernetes, encompassing pods, nodes, and clusters, and their symbiotic relationships facilitating a harmonious operational environment.

The Need for Automation

Automation emerges as a vanguard in managing complex environments effortlessly, fostering efficiency, reducing downtime, and ensuring the optimal utilization of resources.

Efficiency and Scalability

Automation in Kubernetes ensures that clusters can dynamically scale based on the workload, fostering efficiency, and resource optimization.

Reduced Human Error

Automating repetitive tasks curtails the scope of human error, facilitating seamless operations and mitigating security risks.

Cost Optimization

Through efficient resource management, automation aids in cost reduction by optimizing resource allocation dynamically.

Automation Tools and Processes

top devops tools

CI/CD Pipelines

Continuous Integration and Continuous Deployment (CI/CD) pipelines are at the helm of automation, fostering swift and efficient deployment cycles.

pipeline:
  build:
    image: node:14
    commands:
      - npm install
      - npm test
  deploy:
    image: google/cloud-sdk
    commands:
      - gcloud container clusters get-credentials cluster-name --zone us-central1-a
      - kubectl apply -f k8s/

Declarative Example 1: A simple CI/CD pipeline example.

Infrastructure as Code (IaC)

IaC facilitates the programmable infrastructure, rendering a platform where systems and devices can be managed through code.

apiVersion: v1
kind: Pod
metadata:
  name: mypod
spec:
  containers:
  - name: mycontainer
    image: nginx

Declarative Example 2: Defining a Kubernetes pod using IaC.

Configuration Management

Tools like Ansible and Chef aid in configuration management, ensuring system uniformity and adherence to policies.

- hosts: kubernetes_nodes
  tasks:
    - name: Ensure Kubelet is installed
      apt: 
        name: kubelet
        state: present

Declarative Example 3: Using Ansible for configuration management.

Section 3: Automation Use Cases in Kubernetes

Auto-scaling

Auto-scaling facilitates automatic adjustments to the system’s computational resources, optimizing performance and curtailing costs.

Horizontal Pod Autoscaler

Kubernetes’ Horizontal Pod Autoscaler automatically adjusts the number of pod replicas in a replication controller, deployment, or replica set based on observed CPU utilization.

apiVersion: autoscaling/v2beta2
kind: HorizontalPodAutoscaler
metadata:
  name: myapp-hpa
spec:
  scaleTargetRef:
    apiVersion: apps/v1
    kind: Deployment
    name: myapp
  minReplicas: 1
  maxReplicas: 10
  metrics:
  - type: Resource
    resource:
      name: cpu
      target:
        type: Utilization
        averageUtilization: 50

Declarative Example 4: Defining a Horizontal Pod Autoscaler in Kubernetes.

Automated Rollouts and Rollbacks

Kubernetes aids in automated rollouts and rollbacks, ensuring application uptime and facilitating seamless updates and reversions.

Deployment Strategies

Deployment strategies such as blue-green and canary releases can be automated in Kubernetes, facilitating controlled and safe deployments.

apiVersion: apps/v1
kind: Deployment
metadata:
  name: myapp
spec:
  strategy:
    type: RollingUpdate
    rollingUpdate:
      maxSurge: 25%
      maxUnavailable: 25%
  selector:
    matchLabels:
      app: myapp
  template:
    metadata:
      labels:
        app: myapp
    spec:
      containers:
      - name: myapp
        image: myapp:v2

Declarative Example 5: Configuring a rolling update strategy in a Kubernetes deployment.

Conclusion: The Future of Kubernetes with Automation

As Kubernetes continues to be the front-runner in orchestrating containerized applications, the automation integral to its ecosystem fosters efficiency, security, and scalability. Through a plethora of tools and evolving best practices, automation stands central in leveraging Kubernetes to its fullest potential, orchestrating seamless operations, and steering towards an era of self-healing systems and zero-downtime deployments.

In conclusion, the ever-evolving landscape of Kubernetes managed through automation guarantees a future where complex deployments are handled with increased efficiency and reduced manual intervention. Leveraging automation tools and practices ensures that Kubernetes clusters not only meet the current requirements but are also future-ready, paving the way for a robust, scalable, and secure operational environment.


References:

  1. Kubernetes Official Documentation. Retrieved from https://kubernetes.io/docs/
  2. Jenkins, CI/CD, and Kubernetes: Integrating CI/CD with Kubernetes (2021). Retrieved from https://www.jenkins.io/doc/book/

By

Read More

× Close