DevOps
-

Best Cloud Hosting for Kubernetes in 2026: Complete Cost Comparison
Compare the top Kubernetes hosting providers in 2026. DigitalOcean, Vultr, Linode, AWS EKS, and Google GKE with real pricing data and feature…
-
DevOps Tools Comparison 2026: The Complete Guide to Building Your Stack
The definitive comparison of DevOps tools in 2026. CI/CD, IaC, monitoring, Kubernetes, and security tools compared with honest pros and cons for…
-
OpenTelemetry Achieves GA Status as 89% of Organizations Consolidate Observability Stacks
Disclosure: Some links in this article are affiliate links. We may earn a small commission at no extra cost to you. The…
-

How do I: Manage Infrastructure at Scale with Rancher Fleet
Disclosure: Some links in this article are affiliate links. If you make a purchase through these links, we may earn a small…
-
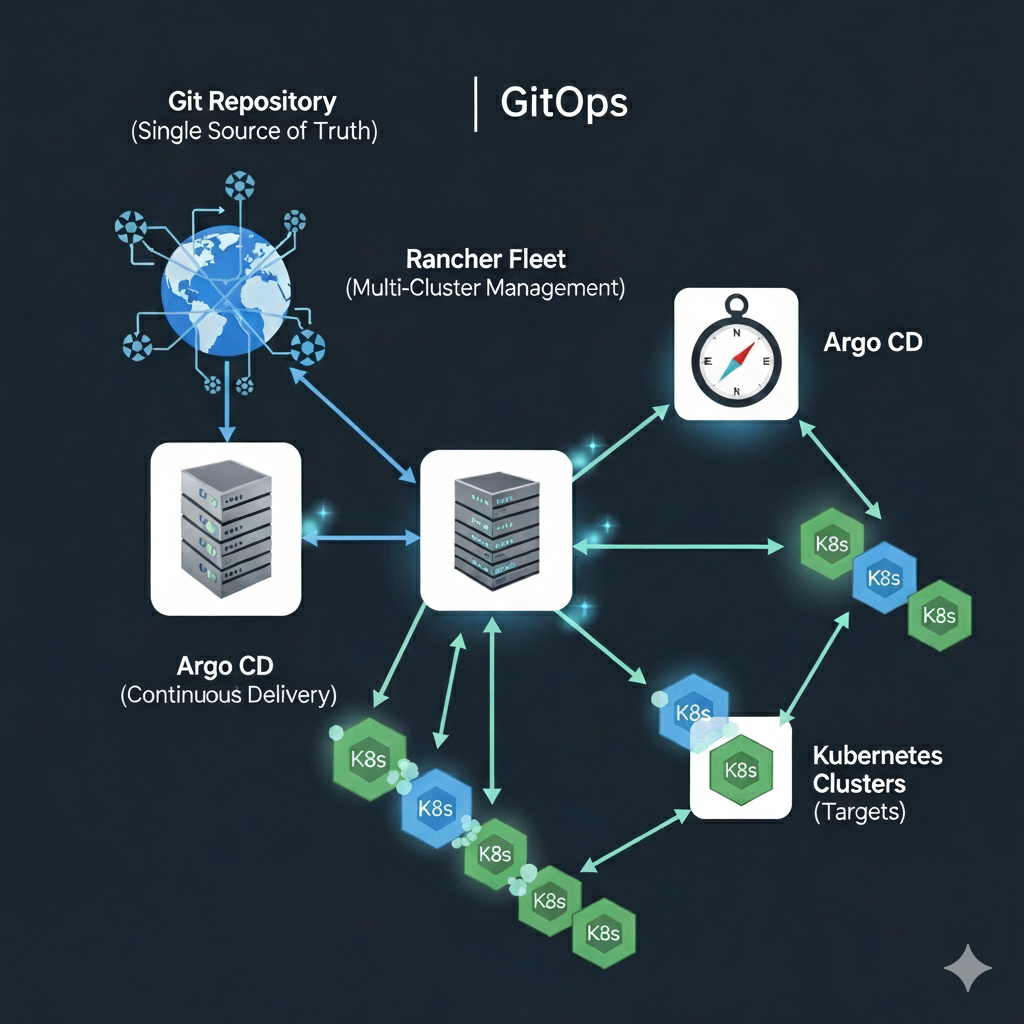
How do I: Build a GitOps Pipeline in Argo
Disclosure: Some links in this article are affiliate links. We may earn a small commission at no extra cost to you. Part…
Search
Latest Posts
Latest Comments
No comments to show.