Kubernetes
-
A Guide to MCP for Kubernetes Management
As enterprises increasingly adopt Kubernetes for container orchestration, the complexity of managing distributed systems continues to grow. Enter the Model Context Protocol…
-

How do I: Manage Infrastructure at Scale with Rancher Fleet
Part 3: Scaling GitOps with Rancher Fleet – Managing Infrastructure at Scale Recap of Part 1 In the second part of this…
-
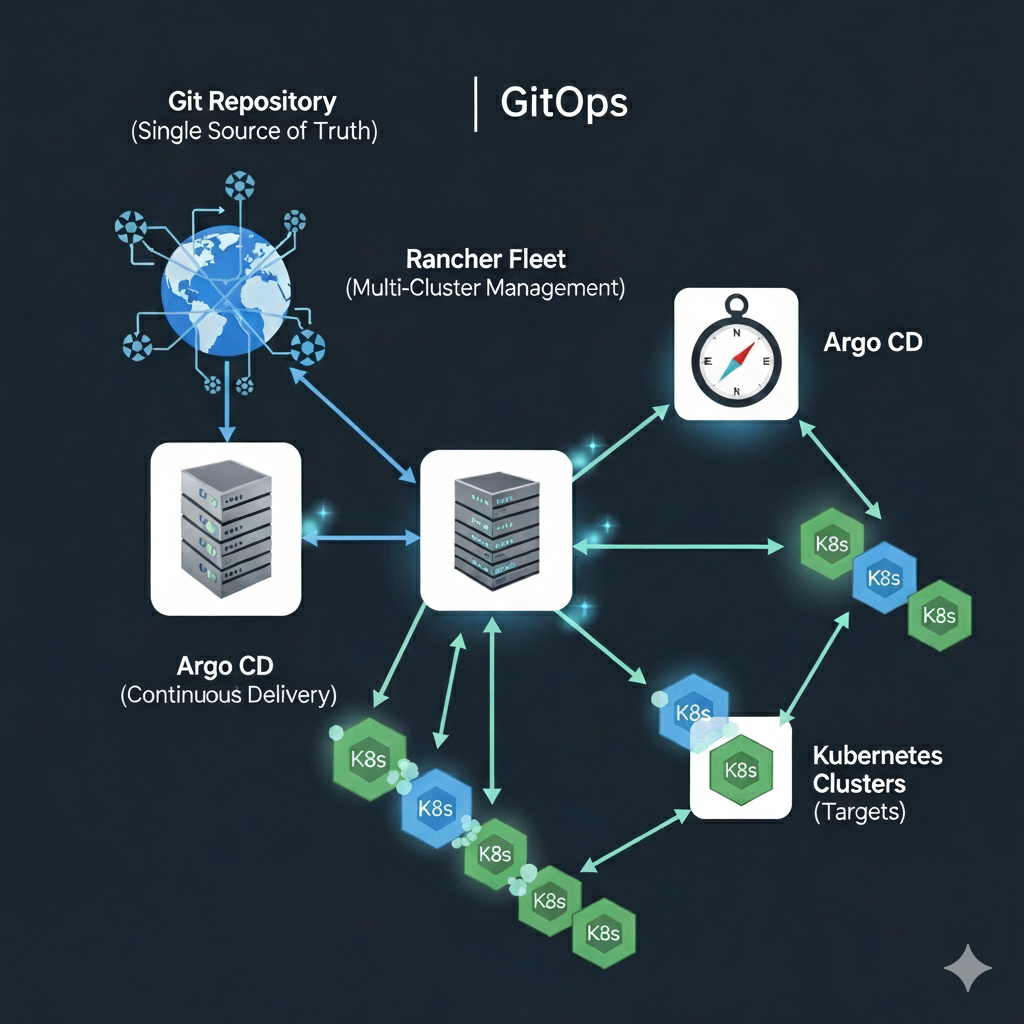
How do I: Build a GitOps Pipeline in Argo
Part 2: Building a GitOps Pipeline with Rancher Fleet and Argo – From Code to Deployment Recap of Part 1 In the…
-
Mastering Harbor and ArgoCD Integration: A Complete Guide for Enterprise DevOps
Learn how to integrate Harbor container registry with ArgoCD for secure, scalable GitOps workflows. Complete guide covering setup, security best practices, common…
-
Enterprise GitOps with ArgoCD and Harbor on RKE2: Complete Integration Guide
Introduction: Building the Complete GitOps Stack In Part 1 of this series, we established a robust Harbor container registry on RKE2 using…
Search
Latest Posts
Latest Comments
No comments to show.